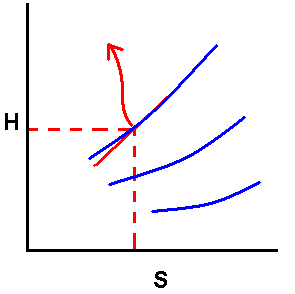
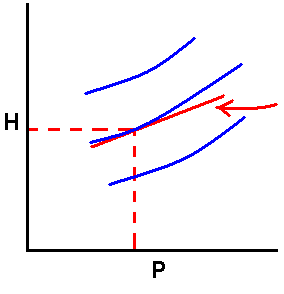
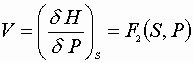
Application: Mollier diagrams
Using this diagram as a starting point, how do I construct a similar U – T diagram?
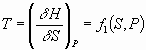
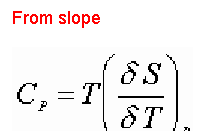
From above plot:
 |
 |
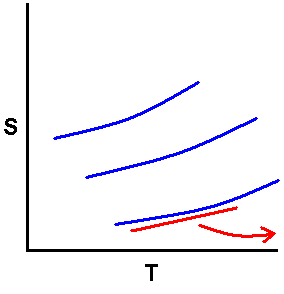
Now use f1 and f2 to construct table of P at each V & T
![]()
Now plot:
1) 
|
Finally:
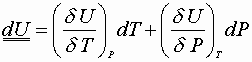
![]()
Substitute:
Constant P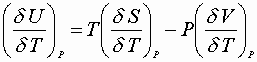
Also:
Constant T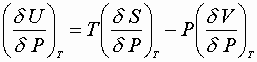
Using both in
3):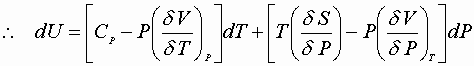

Everything is in terms of P, V, T!
Integrate w. r. t. T & P to find U!
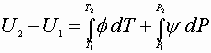
Using data provided in original plots we can generate U – T plot.
What if we don’t have comprehensive data?