Brief Manual on Contour Mapping Program

 
1.  First, choose the type of contour to be used.

    2. Depending on which type, edit points A and B to parameterize the contour:


(Note: when changing values in the text boxes, the font changes to red color to indicate that the new input has not yet been accepted. In order to accept the edited values, press the [ENTER] or [TAB] key. For example:
)
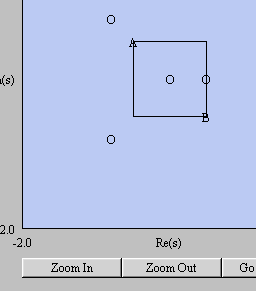
a) Rectangle: points A and B are in the opposite corners

     
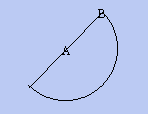
      b) Semicircle: point A is the center point while B determines the orientation and radius


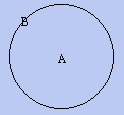
      c) Circle: point A is the center point while B determines the radius ( and the start point of contour traversal ).
3. Enter Zeros by either clicking on [ADD Real] or [ADD Complex] buttons:
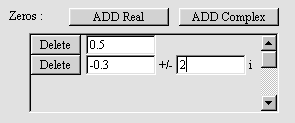
      Text fields will appear accordingly, together with a corresponding delete button. A maximum of 10 entries are allowed, so the scrollbar to the side could be used to show the desired entries. The same rules for editing text (cf. Note in step 2 above) apply, i.e. hit [ENTER] to accept entries/edits. To remove an entry, simply click on the corresponding [Delete] button.
      The zero points will appear with 'O' symbols in the plot to the left. Use either [Zoom In] and [Zoom Out] button to check the position of the zeros. Care should be taken to prevent the zeros from lying on the contour's path.


    4. Enter Poles the same way Zeros were entered. The poles will appear as 'X' symbols in the plot on the left. The same as the previous case of zeros, none of the poles should lie on the contour.

    5. Once the choices for contour, zeros and poles are correctly entered. Click on the [Go To Map] button to proceed to the complex mapping process.

      (There will be opportunities later to come back to this Setup page, so it is not critical to have made final choices before clicking on the [Go To Map] button.)
       
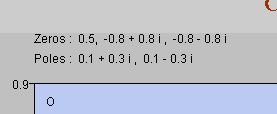
    6. On the Mapping page, the upper left corner will show the chosen zeros and poles.

    7. This is important to note specially in the cases where there are repeated zeros or repeated poles, since the plot will not be able to show the distinction.

    8. Now use the scrollbar below the page to start clockwise traversal of the chosen contour.
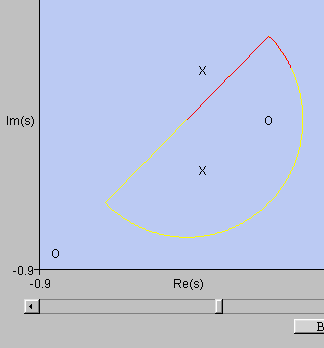
    9. Observe the plot to the right of the page. This is the complex map of the transfer function G(s)=num(s)/den(s) corresponding to the contour.
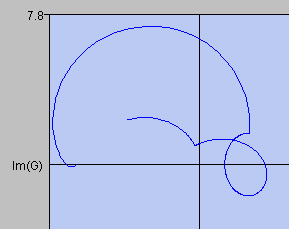
     

      At first traversal a blue curve will move corresponding to the movement of scrollbar to the right. Moving the scrollbar to the left will leave a yellow curve.
      Also note that the crosshairs intersect at the origin. This is to facilitate the counting of encirclements around the origin as the complex variable s takes on different values along the contour path.


    10. To change the settings, i.e. contour, poles or zeros, click on [BACK TO SETUP] button
    11. When in either the Setup page or Mapping page, you can print using the browser's Print menu command. However, make sure that landscape has been chosen.


This page is maintained by Tomas B. Co (tbco@mtu.edu). Last revised 10/19/1999.

     Tomas B. Co
     Associate Professor
     Department of Chemical Engineering
     Michigan Technological University
     1400 Townsend Avenue
     Houghton, MI 49931-1295

Back to Homepage