Project 1

Due Jan. 26, 2001  5pm
 

(For the simulations, you may use the spreadsheet to implement Euler methods. A tutorial (click here) is available in the web. You may also use Matlab or MathCad if you prefer.)
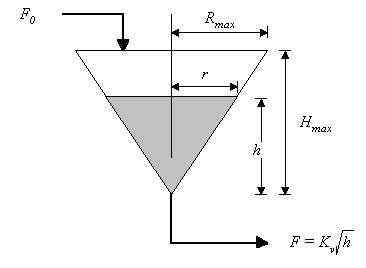
  1. A liquid of constant density is fed at a constant volumetric rate Fointo a conical tank of height Hmax and maximal radius Rmax. The flow out of the tank is Kvh1/2 where h is the height of the liquid in the tank and Kv is the valve coefficient (see Figure 1)

Figure 1. Conical Tank System.


    1. Obtain a dynamic model which describes the height of liquid in the tank.
    2. Using the model, how is the steady state value of h affected by changing Fo ? Kv ? Rmax? and Hmax? Explain.
    3. What is the effect of changing Rmax on the rate of change of h ? Why do you expect this ?
    4. Simulate the system in order to verify your predictions using the following nominal parameters:
Rmax = 5 ft

Hmax = 10 ft

Kv =1 ft2 ft1/2/ s

h(0) = 2 ft

Fo =2 ft3/s

To check the effects of Rmax on steady state and rate of response, vary the values of Rmax to 3, 4, 5, 6 and 7 ft. Next, put Rmax back to 5 ft and check the effects of changing valve coefficient Kv to 0.9, 1.0 and 1.1. After putting Kv back to 1.0, investigate the effects of the feed rate FO to 1.7, 2, and 2.3. Finally, set Fo back to 2.0 and investigate the effects of starting the simulation at different initial conditions, i.e. h(0) at 3, 4 and 5 ft. Summarize the trends observed in a table, for example:
 
Changes in Variable
Effect on Steady State
Effect on Rate of Response
As x increases

:

Increases

:

Faster

:
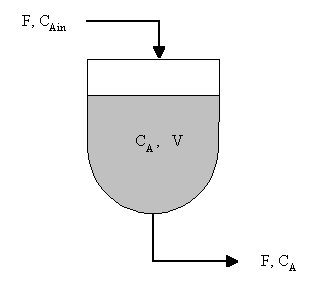
  1. First order linear systems. Liquid is fed to a storage tank in which the tank level (hence also tank volume) is held constant by a control system (not shown) in Figure 2

Figure 2. Storage Tank at Constant Volume


    1. Show that the component balance for A is given by


      where t=V/F is called the residence time of the mixing tank, or the time constant. V is the volume of liquid in the tank. F is the volumetric flow rate in and out of the tank. CA is the concentration of A in the tank while CAin is the conentration of A in the feed.

     
    1. Simulate the system using the following parameters:
    t= 1 sec
    CAin = 0.2 lb/ft3
    CA(0) = 0.1 lb/ft3
      Obtain another plot using t=2 sec and CA (0)=0.4. What do you observe?
    1. The time constant t is a very useful indicator of the speed of response. It represents the amount of time the process variable reaches 63.2 % from initial point to steady state. Using the two plots obtained for t=1 and t=2 secs, verify that at these times, the variable has indeed proceeded 63.2 % from CA (0) towards steady state.
  1. Second Order Systems. Suppose you are given a system described by
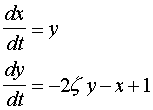
where z is a parameter of the system with initial conditions x(0)=0, dx/dt(0)=0. This could be rewritten in a form more suitable to simulators by using the following substitutions:
which then converts the original problem to be
Simulate the following case: z=1.5, 1.0, 0.5, 0.2, 0 and -0.1. The parameter z is known as the damping coefficient and it is used to indicate whether oscillations are present or not. Summarize your observations. (I suggest simulating from t=0 to 25.)